1. Report window
This is the main graphical user interface when Seg2Dgel is run with the -gui switch. It contains a text logging area (center), pull-down menus, and often-used command buttons at the bottom.
1. Graphical user interface Report window
2. Command line Options window
3.
Stages of processing - investigate with the ImageViewer window
3.1
original image
3.2
average image
3.3
propagated central core image
3.4
magnitude 2nd derivative image
3.5
background image
3.6
segmented image
3.7
original - segmented image
3.8
final user Report Window summary statistics
4. Investigating histograms of image density or spot features with ImageViewer
4.1
histogram of spot areas
4.2
histogram of spot densities
4.3
histogram spot density ranges
4.4
histogram of image pixel densities
4.5
horizonal slice of image pixel densities
5. Segmenting low resolution 2D-LC-MS data
5.1
Original 2D LC-MS low resolution image
5.2
Segmented 2D LC-MS segmented image
5.3
ImageViewer of segmented 2D LC-MS image - density histogram
5.4
ImageViewer of segmented 2D LC-MS image - Sx/Sy histogram
1. Report window
This is the main graphical user interface when Seg2Dgel is run with
the -gui switch. It contains a text logging area (center), pull-down menus, and often-used
command buttons at the bottom.

2. Command line Options window
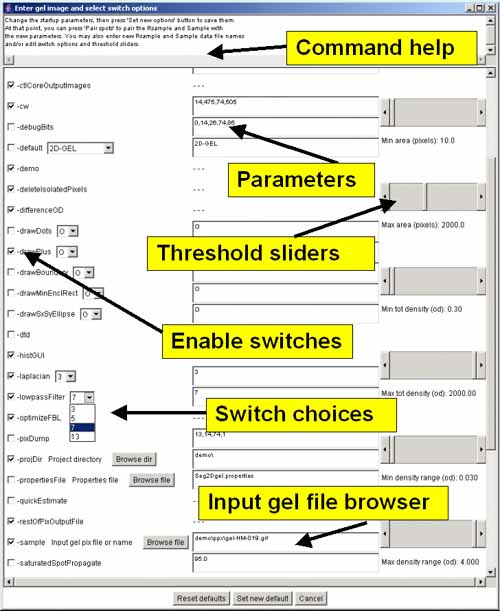
This popup window is used to editing the command line parameter
options prior to resegmenting a gel. The Options window is poped up
by pressing the Image viewer button in the Report window.
3. Stages of processing - images generated during the segmentation
If you enable the segmenter to generate images, you can view the
various stages of processing using the ImageViewer. These are enabled
using the -ctlCorePixOutputFile, -restOfPixOutputFile,
and -segmentedPixOutputFile switches.3.1 Original image shown in the Image viewer
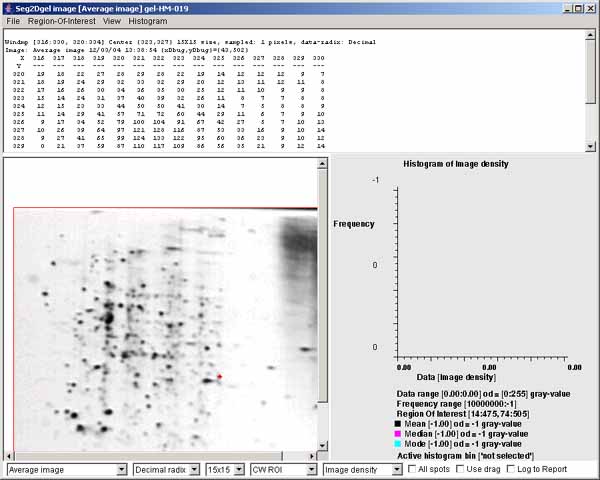
This is an example of the original gel image (used in this example and
included in the download of Seg2Dgel). The image is displayed in the
Image viewer window that is poped up by pressing the Image
viewer button in the Report window. A 15x15 pixel window of numeric
data is shown at the top of the image (the spot has a red "+"). Because
the radix was set to "OD radix", the data is in optical density values
rather than gray values.
3.2 Average image of the original image using a gaussian filter
During the segmentation procedure, the origial image is first smoothed
using a gaussian filter using
the -lowPass:7 7x7 pixel filter. A 15x15 pixel window of
decimal numeric data is shown at the top of the image (the spot has a
red "+").
3.3 Propagated central core image
Then, the propagated central core image computing by segmenting the
average image using a laplacian and spot finding
algorithm described in the reference manual using the
-laplace:5 7x7 pixel filter.. A 15x15 pixel window of decimal
numeric data is shown at the top of the image (the spot has a red
"+"). Pixels within the central core have values in the range [2:99]
whereas pixels in the propagated central core have values in the range
[102:199].
3.4 Magnitude 2nd derivative image
Part of the computation of the propagated central core image involves
computing the magnitude
of the laplacian image described in the reference manual. A 15x15
pixel window of decimal numeric data is shown at the top of the image
(the spot has a red "+"). 
3.5 Background image
After the spots are initially segmented, the spots are removed from a
copy of the original image. This image is essentially the background
of the gel. This is then smoothed using a zonal notch filter
described in the reference manual. This background image is then used
as a table-lookup to estimate the background at the centroids of
spots. A 15x15 pixel window of numeric data is shown at the top of
the image (the spot has a red "+"). Because the radix was set to "OD
radix", the background data is in optical density values rather than
gray values. The density corrected for background is computed as
density' = density - (area * meanBackgroundDensity).

3.6 Segmented image
The segmented image image shows the spots extracted from the original
image. The centers of spots are indicated with a white "+". The data
for the selected spot (red "+") is shown at the top. (When debugging,
additional information about the spot is available.)
3.7 The "RestOf" image or (original image - segmented image)
The "RestOf" image is computated as the original image less the
segmented image. This shows any spots or parts of spots that the
segmenter may have missed and can be used to help judge the quality of
the segmentation. The centers of spots are indicated with a black
"+".
3.8 final user Report Window with showing summary statistics
The Report Window shows the sumary results of the segmentation. This
includes the numbers of spots segmented, and omitted because of failing
the threshold sizing (by area, density, and density range). It also shows
the names of the images that were generated in the tmp directory.
Finally, it shows the amount of time the segmenter spent in the
various stages of processing.
4. Investigating histograms of image density or spot features with
ImageViewer
It is also possible to investigate distributions of spot density and
other spot properties using histograms. It may also be used for data
filtering subsets of spots by interacting with the histogram.4.1 The histogram of spot areas within the computing window ROI of
segmented image
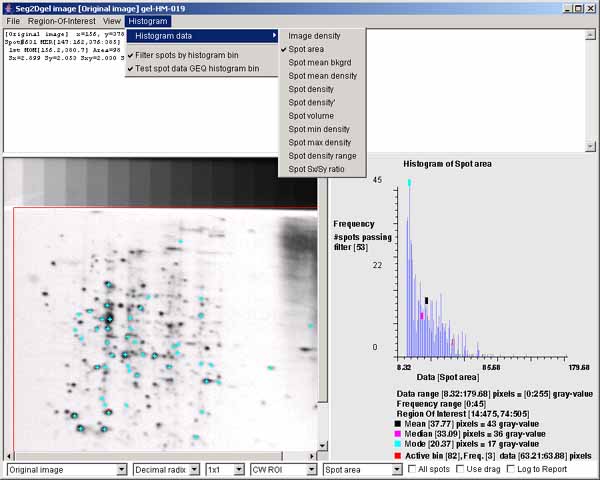
The histogram may display various spot features. This shows the spot
areas under the computing window (CW ROI). You may change the ROI
after the segmentation using the (Region-Of-Interest | Set ROI type
| CW ROI) menu command in the Image Viewer. The "Spot area" was
selected using the (Histogram | Histogram data | Spot area)
menu command. You may data filter spots that are have an area greater
or equal (GEQ) than the histogram bin selected by clicking on it are
shown in the image on the left as cyan colored "+" marks. The data
filter is enabled by the (Histogram | ![]() Filter spots by histogram bin) menu
command. You set the The data filter test to GEQ (or LEQ) the bin by
the (Histogram |
Filter spots by histogram bin) menu
command. You set the The data filter test to GEQ (or LEQ) the bin by
the (Histogram | ![]() Test spot data GEQ
histogram bin) menu command. Clicking on the histogram will
select that bin and display the corresponding data for that bin. Note,
if you enable the
Test spot data GEQ
histogram bin) menu command. Clicking on the histogram will
select that bin and display the corresponding data for that bin. Note,
if you enable the ![]() Use drag)
checkbox, you can change the bin by draging the mouse.
Use drag)
checkbox, you can change the bin by draging the mouse.
4.2 The histogram of spot densities within the computing window ROI of
segmented image
The histogram may display various spot features. This shows the spot
integrated densities under the computing window (CW ROI). You may
change the ROI after the segmentation using the (Region-Of-Interest
| Set ROI type | CW ROI) menu command in the Image Viewer. The
"Spot density" was selected using the (Histogram | Histogram data |
Spot density) menu command. You may data filter spots that are
have a total spot density greater or equal (GEQ) than the histogram
bin selected by clicking on it are shown in the image on the left as
cyan colored "+" marks. The data filter is enabled by the
(Histogram | ![]() Filter spots by
histogram bin) menu command. You set the The data filter test to
GEQ (or LEQ) the bin by the (Histogram |
Filter spots by
histogram bin) menu command. You set the The data filter test to
GEQ (or LEQ) the bin by the (Histogram | ![]() Test spot data GEQ histogram bin) menu
command. Clicking on the histogram will select that bin and display
the corresponding data for that bin. Note, if you enable the
Test spot data GEQ histogram bin) menu
command. Clicking on the histogram will select that bin and display
the corresponding data for that bin. Note, if you enable the ![]() Use drag) checkbox, you can change
the bin by draging the mouse.
Use drag) checkbox, you can change
the bin by draging the mouse.
4.3 The histogram of spot density range within the computing window ROI of
segmented image
The histogram may display various spot features. This shows the spots
density ranges (i.e., max density/pixel - min density/pixel) under the
computing window (CW ROI). You may change the ROI after the
segmentation using the (Region-Of-Interest | Set ROI type | CW
ROI) menu command in the Image Viewer. The "Spot density range"
was selected using the (Histogram | Histogram data | Spot density
range) menu command. You may data filter spots that are have a
total spot density range (maxD - minD) greater or equal (GEQ) than the
histogram bin selected by clicking on it are shown in the image on the
left as cyan colored "+" marks. The data filter is enabled by the
(Histogram | ![]() Filter spots by
histogram bin) menu command. You set the The data filter test to
GEQ (or LEQ) the bin by the (Histogram |
Filter spots by
histogram bin) menu command. You set the The data filter test to
GEQ (or LEQ) the bin by the (Histogram | ![]() Test spot data GEQ histogram bin) menu
command. Clicking on the histogram will select that bin and display
the corresponding data for that bin. Note, if you enable the
Test spot data GEQ histogram bin) menu
command. Clicking on the histogram will select that bin and display
the corresponding data for that bin. Note, if you enable the ![]() Use drag) checkbox, you can change
the bin by draging the mouse.
Use drag) checkbox, you can change
the bin by draging the mouse.
4.4 The histogram of image pixel density range within the computing
window ROI of segmented image
The histogram may display various spot features. This shows the spots
density ranges (i.e., max density/pixel - min density/pixel) under the
computing window (CW ROI). You may change the ROI after the
segmentation using the (Region-Of-Interest | Set ROI type | CW
ROI) menu command in the Image Viewer. The "Image density" was
selected using the (Histogram | Histogram data | Image density)
menu command. Clicking on the histogram will select that bin and
display the corresponding data for that bin. Note, if you enable the
![]() Use drag) checkbox, you can
change the bin by draging the mouse.
Use drag) checkbox, you can
change the bin by draging the mouse.
4.5 Horizonal slice of image pixel densities
You can view a horizontal and/or a vertical pixel density slice
through the image. This figure shows the horizontal slice. You enable
the slice display by the (View | ![]() Horizontal slice) menu checkbox command
in the Image Viewer. You may simultaneously enable the slice display
by the (View |
Horizontal slice) menu checkbox command
in the Image Viewer. You may simultaneously enable the slice display
by the (View | ![]() Vertical slice)
menu checkbox command. Note, if you enable the
Vertical slice)
menu checkbox command. Note, if you enable the ![]() Use drag) checkbox, you can move the
slice by draging the mouse.
Use drag) checkbox, you can move the
slice by draging the mouse.
5. Segmenting low resolution 2D-LC-MS data
The segmenter may be used for segmenting low resolution 2D LC-MS image
data.5.1 Original 2D LC-MS low resolution image image to be segmented
Original 2D LC-MS image. This shows the low resolution image data
input into the spot segmenter (thanks to Laboratory of Proteomics and
Analytical Technologies, NCI-Frederick).
5.2 Segmented 2D LC-MS image resulting from spot segmentation
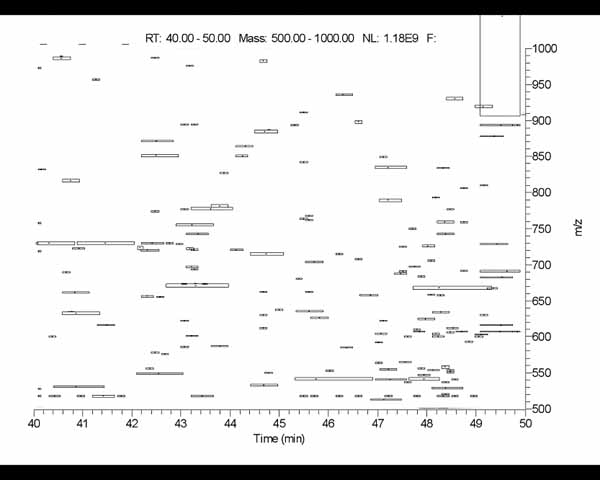
Segmented 2D LC-MS image resulting from spot segmentation. This shows
the use of a horizontal filter on low resolution 2D-LC-MS image data
(thanks to Laboratory of Proteomics and Analytical Technologies,
NCI-Frederick). It uses a 3x9 pixel horizontal laplacian filter
specified as -laplace:H,3,9. The ROI is about 800x600 in the
center of the image (excluding the labeling), with
-drawMinEnclosingRect enabled to draw boxes around each
detected spot. The -thrSxSxRatio:2.5,100.0 threshold sizing was
was used to filter out small noisy line segments that uses a density
weighted spot X and Y deviation ratio Sx/Sy >= 2.5. Thanks to
Laboratory of Proteomics and Analytical Technologies,
NCI-Frederick. 
| Contact us | Seg2Dgel is a contributed program available at open2dprot.sourceforge.net/Seg2Dgel | Revised: 10/04/2005 |