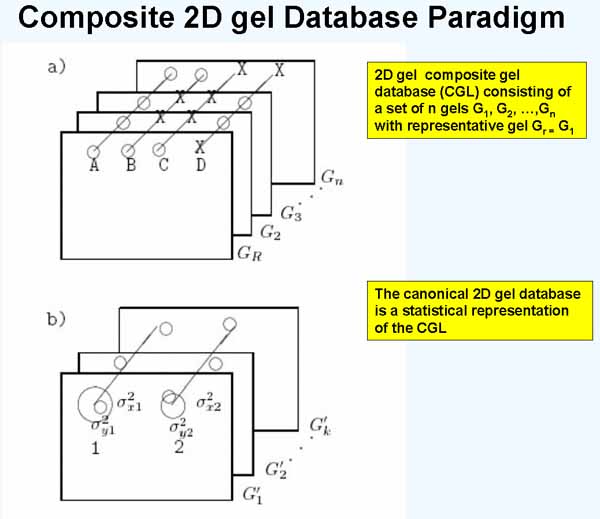
Figure 1. Three-dimensional composite gel database model. a) Illustrates a composite gel database consisting of data from a set of 2D-gels. Corresponding paired spots (circles) are denoted by diagonal lines drawn through them. Such sets of corresponding spots are called Rspot sets. One of the gels is selected to be a reference or Rgel, denoted Gr. The circle means the spot is present and the X means that it is missing in that gel. Spot R1 occurs in all n gels. Spot R2 occurs in the Rgel and in one other gel. Spot R3 is only in the Rgel. Spot R4 is not present in the Rgel but is in most of the other gels. Spots R1, R2, and R3 are in the unextended Rspot database (since they occur in the Rgel) while spot R4 is in the eRspot part of the database (since it does not occur in the Rgel). b) Shows the basis of using mean spot positions for estimating canonical spots for a subset of k gels from the n gel database. The canonical spot can then be used to estimate the position of spots missing from some of the other gels. The mean and variance (varX,VarY) of Rspot positions across a set of gels is mapped to the coordinate system of the Rgel. When that has been done, the set of gels of the same experimental class can be replaced by a single averaged gel called the Cgel' (the estimate of the canonical gel). The mean displacement vector of a canonical spot from its associated landmark spot (in any gel under discussion) is used to extrapolate the position in gels where the expected canonical spot is missing.
Another way of thinking about the CGL DB is as consisting of Rspot sets in a "3-dimensional spread sheet". Each Rspot set (defined in Figure 1) then is a distribution of protein concentrations for that protein as seen across the set of gels - that is the lines connecting spots across gels is illustrated in Figure 1. This then allows us to test each Rspot for statistically significant differences when the gels in the CGL DB are taken from different disease states or experimental conditions. Exploratory data analysis consists of partitioning and searching the data in different ways to find the "view" showing the meaningful differences between the subsets of data.
Tukey in [GalW86] and others have suggested that the use of visual feedback is essential in exploratory data analysis. We have available a number of tools, both visual and numeric, with which to dissect a set of data and we will be illustrating some of them here. Fisher et al. in [GalW86] suggest a definition of exploratory data analysis that is appropriate for 2D gel databases: "Exploratory data analysis can be characterized as a search for regularity or structure among objects in an environment, and the subsequent interpretation of discovered regularity."
Large numbers of gels may be analyzed by GELLAB-II, improving statistical power, making spot differences more apparent, and more easily identifying outlier spots or gels using clustering techniques.
The data reduction and analysis consists of three main stages: (1) data acquisition, (2) data reduction, and (3) exploratory data analysis shown in the flow chart in Figure 2 . Stages (1) and (3) are performed interactively while (2) is performed automatically in the background as a batch process. We discuss (1) and (3) here. Figure 3 shows a flow chart of the iterative process used in the exploratory data analysis.
[LemP89a] P. F. Lemkin, E. P. Lester (1989) Database and Search
Techniques for 2-D Gel Protein Data: A Comparison of Paradigms For
Exploratory Data Analysis and Prospects for Biological Modeling,
Electrophoresis 10(2) 122-140.
[LemP89b] P. F. Lemkin, GELLAB-II, A workstation based 2-D
electrophoresis gel analysis system, 53-57, in T. Endler, S. Hanash
(Eds), Two-Dimensional Electrophoresis, VCH Press, W.
Germany, 1989.
[LemP93] P. F. Lemkin,
GELLAB-II Reference Manual (PDF), Draft, 1993, 677 pages.
[LipL80] L. E. Lipkin, P. F. Lemkin (1980) Database techniques for
multiple PAGE (2D gel) analysis, Clin. Chem. 26,
1403-1413.
[SchR88] R. W. Scheifler, J. Gettys, R. Newman, The X Window
System, Digital Press, Bedford, MA, 1988.
[GalW86] W. A. Gale, Artificial Intelligence and Statistics,
Addison-Wesley, Reading, MA, 1986.
[MyrJ93a] J. E. Myrick, S. P. Caudill, M. K. Robinson, I. L.
Hubert (1993) Quantitative two-dimensional electrophoretic detection
of possible urinary protein biomarkers of occupational exposure to
cadmium, Appl. Theoret. Electrophoresis 3, 137-146.
[MyrJ93b] J. E. Myrick, P. F. Lemkin, M. K. Robinson, K. M.
Upton (1993) Comparison of the Bio Image Visage 2,000(tm) and the GELLAB-II
two-dimensional electrophoresis image analysis systems, Appl.
Theoret. Electrophoresis 3, 335-346.
Go to
GELLAB-II |
LECB |
NCI Home Page
]
                                                                User or Batch
                                                                Processing
   ---------------------------------------------------
   | DATA ACQUISITION: gel scanning, enter gel       | Interactive
1. | experiment information, region of interest,     |
   | and  OD calibration.                            |
   ---------------------------------------------------
                              |
                              V
   ---------------------------------------------------
   | BATCH JOBS CREATION: given project name, list   | Interactive
   | of N gels, experimental classes, reference      |
2. | gel.                                            |
   ---------------------------------------------------
                              |
                              V
   ---------------------------------------------------
   | LANDMARK N-1 gels: to define landmark spots     | Interactive batch
3. | common to the Reference gel and the other gels. |
   ---------------------------------------------------
                              |
                              V
   ---------------------------------------------------
   | SEGMENT N gels: to find and quantitate spots    | Background batch
4. | in gel images generating N Gel Segmentation     |
   | Files (GSF).                                    |
   ---------------------------------------------------
                              |
                              V
   ---------------------------------------------------
   | PAIR SPOTS in N-1 gels with Reference gel: this | Background batch
5. | Generates N-1 Gel Comparison Files (GCF).       |
   ---------------------------------------------------
                              |
                              V
   ---------------------------------------------------
   | BUILD COMPOSITE data base: merge the N-1 GCFs   | Background batch
6. | into a single searchable Composite GeL (CGL) DB.|
   ---------------------------------------------------
                              |
                              V
   ---------------------------------------------------
   | EXPLORATORY DATA ANALYSIS: of composite         |  Interactive
7. | database Search, compute and display `views' of | or
   | 3D (CGL) gel data. Generates images, plots and  |  Background batch
   | tables: Rmaps, mosaics, cluster dendrograms,    |
   | protein expression profiles, (t-, F-, WMW-,     |
   | KW-, missing spots) statistical tests etc.      |
   ---------------------------------------------------
Figure 2. Flow chart showing data reduction and analysis
process. The type of processing is indicated by:
Interactive, background batch, and Interactive
batch. The data reduction is divided into 3 parts: (a) data
acquisition (steps 1-3) which acquires gel images, gel information
and landmarks needed for processing in the following stages; (b) batch
data reduction (steps 4-6) reducing multiple gel image data to
a single composite database by spot segmentation, pairing and
composite database construction; and finally (c) exploratory data
analysis. This last stage is open ended and reports can include
derived images, graphic plots and tables. Additional exploratory data
analysis may also be done using background batch.
     +------->---- Composite Gel (CGL) DB
     |                |
     ^                | Normalize DB                    (setup CGL DB)
     | Yes            V
  Renormalize? -->--- + Set statistics limits,          (change PREFILTER parameters)
     |         No     | Assign gels to experimental classes,
     |                | Set pairing labels, pIe-MW region,
     |                | Set working set of gels,
     |                | Select density normalization method.
     |                | Select experimental classes to compare.
     |                V
     |             Composite Gel DB
     ^                |
     |                | Search DB using one (of many
     |                | possible) tests
     |                V
     |             SEARCH RESULTS LIST (SRL) of Rspots
     |                |
     |  Yes           V
     +------<----- Redo search?                          (analyze results)
     |                |
     |                V
     |             Generate SPSS or SAS files   --->--+
     |             of Rspot set data                  |
     |                |                               |
     |                + <--[original gel image files] |
     |                |                               |
     |                |                        Further analysis
     |                V                               |
     |             RMAP or MOSAIC derived images      |
     ^                |                               |
     | Further        | Display images                |
     | refinement     |                               |
     |                V                               V
     +-----<----- Evaluate visual and numeric results?   (evaluate results)
            No        |
                      | Yes (found putative results)
                      V
Figure 3. A flow chart showing the iterative database search
process used in the exploratory data analysis of the composite gel
(CGL) database (DB). The search results desired might be to find spots
which are significantly different or to find spots whose expression
profiles cluster similarly, etc. These constitute a putative result that
must be further investigated. Iterative search and evaluation
allows testing new hypotheses which arise during the process.
GELLAB-II Graphical User Interface
In order to make GELLAB-II easier to use, we have made improvements to
the interactive components of GELLAB-II. Some of this interaction
deals with manipulating images while some deals with manipulating
textual information. A graphical user interface (GUI) is a
mouse-based method for users to interact with a computer without
having to remember large numbers of commands. Push buttons, pull-down
menus, forms, dialog and popup messages help reduce the amount of
information a user is required to learn in order to use the system.
The Graphical User Interface of GELLAB-II is implemented using the
network based X-Windows System [SchR88]. The overall GUI design
allows the user to interact directly with gel databases through images
by clicking on spots as well as by use of pull-down menus - at all
stages of data reduction. Examples from different parts of the system
are presented.
2D gel data acquisition
Figure 4 illustrates the
initial part of the data acquisition process. Gel specific
information is entered in an experiment data entry form. Then two
regions of interest are defined for the gel: (a) the region in the gel
where the spots are found, and optionally (b) the region where a
neutral density (ND) calibration step-wedge standard scanned with the gel
is found. The ND wedge is used if the scan data is not already
calibrated in optical density (OD). This wedge data is then analyzed
to obtain the calibration and the resultant grayscale-to-OD
calibration curve. All of this information is then associated with the
name of the gel image and is called its accession information.
Experiment information is accessioned though data entry forms - the
fields of which may be user defined or modified.
NOTE: in the following figures (4-5, 7-19)showing screen shots,
clicking on the figure will bring up the high resolution version in
your Web browser so you can see the details.
Figure 4. Accessioning a gel associates gel image file
name, experimental information, optical density calibration, and
region of interest with a unique accession number for that gel. This
information is required in subsequent analysis. The experiment
information is entered in the data entry form on the
left. Except for the accession number and image file name fields
which are fixed, all of the other fields may be defined by the user.
Figure 4.1 Accessioning a gel also lets the user define a the
computing window or region of interest is defined by a
rubber band box in the gel image on the right. Since the BioImage
scanner data is already calibrated in OD, we did not need to calibrate
it. Gel images need to be calibrated in optical density (OD). This
is required for gel scanners not calibrated in OD by analyzing a
calibrated neutral density step wedge scanned with the gel [not
shown]. Batch jobs creation
The data acquisition session finishes by creating three UNIX batch
scripts for doing the data reduction. The first script does
interactive landmarking. When completed, it automatically starts the
second script to segment the spots in the gels into spot lists
followed by pairing the spot lists. Finally, it in turn starts the
third script which runs the composite gel database program on a
special database command language script constructing the initial
database from the paired spot files. At this point the database is
ready for the investigator to begin interactive exploratory data
analysis. The initial data reduction process is illustrated in Figure 2 and the later
exploratory phase is illustrated in Figure 3 .
Landmark gels to define landmark spots
Spot pairing requires corresponding landmark spots to be defined
between the Reference gel and each of the other N-1 gels. Figure 5 shows two gels being interactively
landmarked. Landmarks can be added, deleted, moved or reviewed. Upon
finishing landmarking of the two gels, the set of
(xRi,yRi,xGi,yGi) coordinates for in landmarks (i going from 1
to K landmarks) data for the N-1 gels G is used to update the
landmark database.

Figure 5. Landmarking is an interactive process which defines a
set of corresponding spots between the Reference gel and each of the
other gels in the database. One gel is landmarked at a time. Landmark
spots may be defined, redefined, and deleted.
The two small windows can be flickered to locally align them
about the two putative spots being considered as a corresponding
landmark spot. Flickering images in real time means alternately
displaying the two images in the same space on the screen (switching
every 1/10 to 3 seconds at user controlled rates) while moving one
relative to the other. In these gels from the 77 gel study, the
Reference gel or Rgel on the left shows the landmarks which were
defined. Red indicates it was landmarked in both gels, green that it
is to be landmarked, and blue that it is currently being landmarked.
[You can try this flicker alignment method using our Flicker system
(
http://www.lecb.ncifcrf.gov/flicker on your gel images or images
from Internet gel databases. Flicker is described in an extended
paper of Lemkin et al. (1997) Electrophoresis
18(3-4):461-470.
Composite gel database system - CGELP2
After we have reduced the gel data to paired spot lists, we use the
the composite gel database system (CGELP2) to merge these together
into a single composite gel database file illustrated in Figure 1. The initial database
script did a preliminary normalization of the database and some
initial statistical searches. In addition to constructing the
composite gel database, CGELP2 is used to help perform the exploratory
data analysis. This system has an extensive command line language
which may be invoked by either: a) a dumb terminal, b) batch script
files, c) graphical user interface. The database exploration session
log is displayed in an output window and may be selectively saved in a
disk file at the user's option. The CGELP2 command history is saved
for review or modification and re-execution. This is illustrated in Figure 6.
a) Command Structure of CGL DB program

               Typed or batch script file commands <---+
                                          |            |
                                          |            |
                                          V            |
 +--< Direct manipulation <---- Command Evaluation     ^
 |    Graphical User Interface            |            |
 |                                        |            |
 |                                        V            |
 +-----------<--------- Command History file ----->----+


b) Example from History File generated by CGL DB program
      . . .
   301:gels
   302:limits
   303:set density mode//least-squares//
   304:set srl subsets//directory////
   305:inquire//tp-test/ratio//1,2//0.005//2.0
   306:inquire//print-spot//689////
   307:set srl subsets//assign//tp-test/RatioLimit:2.0 min OD <=1.8, p-value<0.005////
   308:inquire//sort srl//1,2
   309:inquire//sort srl//3,4
   310:inquire//tp-test//1,2//0.005
   311:set srl subsetse//assign//tp-test OD<=1.8, p-value<=0.005////
   312:set srl subset//directory////
   313:set srl subset//list//11////
   314:backup
      . . .
Figure 6. Command evaluation in the composite gel database
program (cgelp2). a) The command
structure of shows the relation of the Graphical User and typed
command interfaces to the Command evaluation. Commands may be invoked
from either the direct manipulation Graphical User Interface (GUI) or
from the typed or file scripted commands. b) Shows examples
of command history entries saved between data analysis
sessions. One or a series of commands from the history may be
recalled, modified and re-executed as part of the exploratory data
analysis process. Items selected from the GUI menus appear first in
the history command string and are followed by any additional
parameters separated by '//'s.
Examples Of Exploratory Data Analysis
We now show some examples from a GELLAB-II exploratory user session.
Because of space, we present just a few of the types of displays
and analyses available.
GUI interface: Dynamic Rmap of spots of interest
Figure 7 shows the composite
database GUI user interface. Notice the pull down menus at the top
(consisting of over 60 top level commands). The gel image on the left
is the "dynamic Rmap". This shows changes in the current spots of
interest during searches of the database. For example, viewing the
results of a search or of a previous search. In addition, the user can
click on spots to inquire about them in the CGL DB.

Figure 7. The composite gel database system display is
shown when first started. The top row of buttons invoke pull-down
menus with over 60 commands with the menu for the FILE
options shown. A dynamic Rmap of the Reference gel for the
77 gel database is shown on the left (any other gel in the database
may be substituted during the data analysis). A variable resolution
and size zoom popup window reflects the cursor position in
the dynamic Rmap. Various mouse and accelerator key actions are
listed in the right scrollable output window. Data in the
output window may also be saved in a log file. The dynamic Rmap is
used for both direct query by the user of any spot in the database. It
is also used for showing which spots result from searches or from
retrieval of significant spots saved from previous database queries.
The dynamic Rmap shows the status of which spots are in the
Search Results List (SRL). The dynamic Rmap shows the landmark
spots with Rspot numbers for the 77 gel database.
Printing protein concentrations by clicking on a spot
Figure 8 shows the dynamic Rmap after
editing the results of a t-test search for spot differences between
two experimental classes (to be discussed).
Figure 9 shows the results of clicking on a spot in the dynamic
Rmap spot which causes its CGL DB data to be displayed in the
scrollable window on the right.
Figure 8. The dynamic Rmap image in the composite gel database
system for the 77 gel database is shown after "editing" Rspots from a
previous database search. Rspots visible in the dynamic Rmap are
those currently in the Search Results List. The user can
delete or add spots in the Search Results List by
clicking on spots in the dynamic Rmap. The RSPOT SUBSETS menu
is shown in the middle of the display. The SRL subsets
directory is in the middle right below the resized popu zoom
window. It shows subsets of Rspots found to be significant and saved
in previous analyses as Search Results List Subsets (denoted
SSRL[i] for subset i). Subset SSRL[3] holds 77 gel spots significant
for CASE/CONTROL differences and has been restored into the SRL and
the dynamic Rmap. Some of the SET SRL SUBSET menu operations
shown in the menu include: Assign-SRL-to-SSRL-subset,
Delete-SSRL-subset, Explicit-definition,
Directory-of-SSRLs, List-SSRL[i], Restore-SSRL[i],
Union, Intersection, Subtract,
SPSS-file-from-SSRL-subset, etc. Note that spot searches can
optionally be restricted to spot in a particular SSRL[i] subset as
part of the PREFILTER (shown in figure 10).

Figure 9. Any Rspot set's numeric values can be displayed
by clicking on the spot in the dynamic Rmap. This causes Rspot set
data from the composite gel database to be reported in the scrollable
window on the right. Data may be presented summarized by a) as
a table sorted by normalized density in the (middle "Rspot
data" popup window) where the spot from each gel is represented, or
b) experimental class in the (lower "Rspot data"
popup window). Two popup windows illustrate this for Rspot[933] in
the 77 gel database. The Print button in the popup windows
may be pressed to print a report of the corresponding window.
Alternatively, if you know the numeric Rspot name of a spot, you can
print it by this number instead of clicking on the spot.
Setting the Rspot PREFILTER prior to a search
Before a search is done, one must design a partition of the gel and
spot feature data and set search parameters. These parameters are
applied to each Rspot set during operations on the database to
determine whether it is "visible" to the database operation. This
pre-testing process is called the PREFILTER.
Figure 10 shows the popup data entry form to review and
selectively change the PREFILTER preferences limits.
Figure 10. The PREFILTER is a set of spot and gel feature
preferences which control database access to gels and Rspot sets in
subsequent searches, analyses and views of the data. The data entry
form is invoked by the SET PREFILTER menu option. This allows
selectively changing these parameters. The PREFILTER is used to
prescreen data before passing it to the particular test to be
performed and is shown for the 77 gel database.
Setting the Gel Experimental Classes prior to a search
When doing a multiple experimental class search, it is necessary to
divide the gels into the corresponding subsets of gels to be compared.
Figure 11shows the results
of the SET CLASSES command which uses the associated gel
experiment information to automatically partition the gels into their
associated classes. When comparing classes, an Rspot (consisting of
corresponding spots from different gels) is automatically subdivided
by class and the PREFILTER applied to each subset of spots from gels
belonging to each class.
Figure 11. The investigator may partition gels by experimental
condition in the composite gel database. Those subsets of gels
with similar experiment condition attributes are called members of the
same experimental class. This display is invoked by the SET
CLASSES menu option for partitioning gels by class name. The gel
experiment accession information is automatically used to partition
the gels into their associated classes. The classes are then used to
specify search conditions later when performing searches. Note that a
gel may belong in more than one class. For example, in the 38 gel
database shown here it may be a CASE or CONTROL gel or a MALE or
FEMALE.
Performing a t-test to find spots differences between classes
Figure 12 shows some of the
parametric and non-parametric INQUIRE search options under the
Query CGL DB pull down menu. Figure 13 shows a dialog box
where the user specifies which experimental classes are to be
compared. Figure 14 shows
the results of performing a t-test at a p-value of less than 0.005
between the case and control gels for the 77 gel study. Spots found
were automatically displayed in the dynamic Rmaps and Search Results
Lists (SRL) while the names of these spots that appear to be
significant appear in the popup window showing them and their t-test
statistics. Figure 15
shows the results for a similar analysis done on the 38 gel study.
These table reports were generated by GELLAB-II. Similarly, any of
the other INQUIRE tests can be performed.
Figure 12. Some possible GELLAB-II database queries are
shown in the pulldown menu for the Query CGL DB button shown
for the 77 gel database. These include parametric, non-parametric,
and other types of searches. These searches are performed on all
Rspots in the entire composite gel database which pass the PREFILTER
test.
Figure 13. The class dialog window pops up for the user to
specify which experimental gel classes are to be used in the
TP-TEST t-test search (or any other multi-class search). The
dynamic Rmap shows the 77 gel Search Results List found data from a
previous search with the same classes and a p-value < 0.005.
Figure 14. The 77 gel database results are shown in the dynamic
Rmap. These were obtained by performing a t-test at a
p-value of < 0.005 between the CASE and CONTROL gels. The Rspots
found were put into the in the Search Results List (SRL) and
automatically displayed in the dynamic Rmap on the left while the
t-statistics features are displayed in the output window on the
right. These spots were verified using mosaic images and additional
numeric analysis. The top part of the right output window shows the
tail end of the t-test search while the bottom shows these Rspots
displayed in a table generated by the SORT SRL BY P-VALUE
operation.
Figure 15. The 38 gel database results are shown in the
dynamic Rmap. These were obtained by performing a t-test at
a p-value of < 0.02 between the CASE and CONTROL gels and verified
using mosaic images and numeric analysis similar to that used for the
77 gel database. Two SORT SRL BY P-VALUE operations were
performed to generate tables for the same Rspots: a) CASE(1)
vs CONTROL(2) shown at the top right, and b) MALE(3) vs
FEMALE(4) shown at the middle right of the output window. The popup
SRL SUBSETS window at the bottom right shows the SRL subsets which
were currently saved in the system with the significant spots we are
working on here saved in SSRL[13].
Reviewing results of previous spot searches
The above Figure 8 shows a SRL
subset directory which lists the names of sets of Rspots found to
be significant (for one reason or another) and were saved previously
during the analysis. Derived sets of Rspots can be created by
performing Boolean operations (union, intersection and subtraction) on
other sets of Rspots. These derived sets can in turn be saved and used
in further operations.
Generating a mosaic image of one spot in N gels
Figure 16 shows one of
several Rspot mosaic images generated Rspot[933]. The mosaic
image(s) are constructed by extracting a small region about each
corresponding gel and assembling them top to bottom and left to right
-- sorted by increasing (normalized) protein concentration. Each panel
is labeled with the gel accession number (gel identifier), protein
concentration and experimental class of the gel.![Mosaic image for Rspot[933] in 77 gel database](fig16.gif)
Figure 16. Shows a mosaic image for an Rspot, Rspot[933], in
the 77 gel database. The mosaic is spread over a number of
sub-images since the panels for a large database will not fit on the
screen at the same time. The mosaic is constructed by extracting a
small region about each corresponding gel and assembling them from top
to bottom and left to right sorted by increasing (normalized) protein
concentration. Each panel is labeled with the gel accession number
(gel identifier), protein concentration and experimental class of the
gel. If there are more than 16 gels in the mosaic, it is spread over
as many additional subimages are required since up to 16 gel panels
appear in each subimage.
Generating protein expression profiles for a set of Rspots
Figure 17 shows protein
expression profiles for the set of Rspots in the SRL. This allows
the investigator to graphically place spots adjacent to one-another to
find similar patterns.
Figure 17. Protein expression profiles are shown for the set of
significant Rspots in the 38 gel database. This option allows the
investigator to graphically place spot profiles adjacent to
one-another to compare patterns.
Generating a dendrogram cluster analysis from selected spots
Figure 18 shows a dendrogram
clustering of the gels based on a subset of the Rspots found to be
significant with p-values from the t-test search less than
0.005. These spots were saved in a SRL subset. We have removed some of
the spots which were probably noise spots from around the edge of the
gel before the clustering by editing them from the dynamic Rmap. 
Figure 18. Shows a dendrogram plot showing clustering 77 gel
study gels base on three significant Rspots [933, 1555, 1558] as a
function of gel density for CASE and CONTROL experimental conditions.
These three spots are shown in the popup zoom window. The number of
gels used in the dendrogram was reduced in each class in order to make
the plot more visible. The average-cluster method is used. Clustering
indicates the predictive power of these spots, taken together, in
separating gels from the experimental classes. Here gels were
clustered as a function of the pattern of Rspot density. Similarly,
Rspots in the SRL may be clusted as a function of the gel expression
profile. Another clustering (
Figure 18a) is done for three significant Rspots [666, 780,759] as
a function of gel density for MALE and FEMALE experimental
conditions.
Generating an ordered protein expression profile table for a set of Rspots
Figure 19 shows an
ordered expression profile table for the set of Rspots in the SRL.
It is another way of graphically clustering spots with similar
expression profiles indicating possibly similar control mechanisms.
Figure 19. A ordered expression profile table is shown in the
scrollable output window for the significant Rspots in the 38 gel
database. The top part of the table shows ratios of means of classes
(m1,m2,m3,m4): m1/m1, m2/m1, m3/m1, and m4/m1. The lower part of the
table shows clustering of most-similar spots with a least square error
distance between expression profiles of < 0.20. Spots which are
most-similar to the spots are on the left part of the table.
Summary
GELLAB-II is a data-reduction system for 2D protein gel scientific
data. Having the proper data handling and analysis tools makes
exploratory data analysis of moderate to large gel databases much
easier. Having sufficient data helps the analysis by making the
statistical patterns more apparent. GELLAB-II hides much of the
complexity of the data reduction from the user by performing it
invisibly in the background under batch. By providing a graphical
interface, user productivity improves and the entire system is easier
to learn and use.
Acknowledgments
Thanks are due Rob Ashmore and Kyle Upton for their help on the UNIX
and X-Windowing aspects of GELLAB-II while they were at
PRI/FCRDC. Also thanks to our other collaborators Lewis Lipkin, Eric
Lester, Carl Merril, Steve Aley, Peter Wirth, Peter Sonderegger, Heinz
Busse, Peter Rogan, and many others for useful suggestions. Some their
ideas were incorporated in GELLAB over the years improving its
capabilities.
References
There are additional GELLAB-II
references on the GELLAB Web site.